Project Canopy (Under Iroko Analytics)

Tools
Figma, React, D3.js, Chart.js
Context & Location
Grant Funding from Fellowship, Remote
Year
2023 and 2024 Summers
ROLES
Front-End Development and UI Design
LINKS


The Problem
The Congo Basin rainforest is 2.5 million square kilometers, spanning six countries, and is home to over 1,000 threatened species and stores more carbon than any other tropical forest on earth. It's also drastically underfunded: the entire Democratic Republic of Congo manages 100 million hectares of forest on a $60 million annual budget. For comparison, New York City's Central Park has a budget of $75 million for 341 hectares. Conservation organizations working in the region face a frustrating situation. The data they need exists: satellite imagery showing deforestation, databases of species protection status, records of which laws apply where. But this information is scattered across institutions, expensive to process, and largely inaccessible to the local NGOs doing frontline work. Bad data leads to bad policy. Bad policy leads to poor conservation outcomes. Donors see poor outcomes and move their funding elsewhere. It's a cycle that keeps repeating.
Project Canopy is a nonprofit trying to break that cycle. They are a neutral data broker, aggregating satellite imagery, species databases, legal frameworks, and conservation project data into tools that anyone can use. Their users range from Cameroonian civil society organizations with minimal budgets to international bodies like the World Bank. I joined as a web development intern through Swarthmore's Richard Rubin Mentorship Program. The program pairs students with faculty mentors and provides summer funding for independent research. I worked remotely across two summers, building frontend components and designing mobile interfaces for their environmental intelligence platform.
What I Built
SPEcies protection platfrom (Web-app data visualization)
The Species Platform addresses a specific problem. A species might be classified as endangered by the IUCN (the scientific body that tracks conservation status), but that doesn't automatically mean it's protected by law. National legislation varies, and international treaties have gaps. The platform lets users query whether a specific species is actually protected in a specific place, surfacing the gaps between scientific assessment and legal reality. I was tasked with creating front-end components that would display and aggregate all the information that could be gathered on a certain species and figure out how to display them in a legible manner.
Building components for this system taught me to think differently about reusability. Some of what I built for the Deforestation Tracker was later adapted for the Species Protection Platform. Working in a small team with limited resources, we couldn't afford the time to rebuild things from scratch. I started paying more attention to how components could flex across contexts.
Species Protection Platform (Mobile mockup)
I was also tasked with reimagining the species protection as a mobile service on Figma. This was my first time making real mockups in Figma for a company. I was tasked with thinking through how conservationists might access this information on mobile, which meant grappling with constraints I hadn't considered before. Screen space is limited, and connectivity in the field is unreliable. A user might be checking the protection status of a species while literally standing in the forest where that species lives. The interface needed to work under those conditions.
Visual Communication
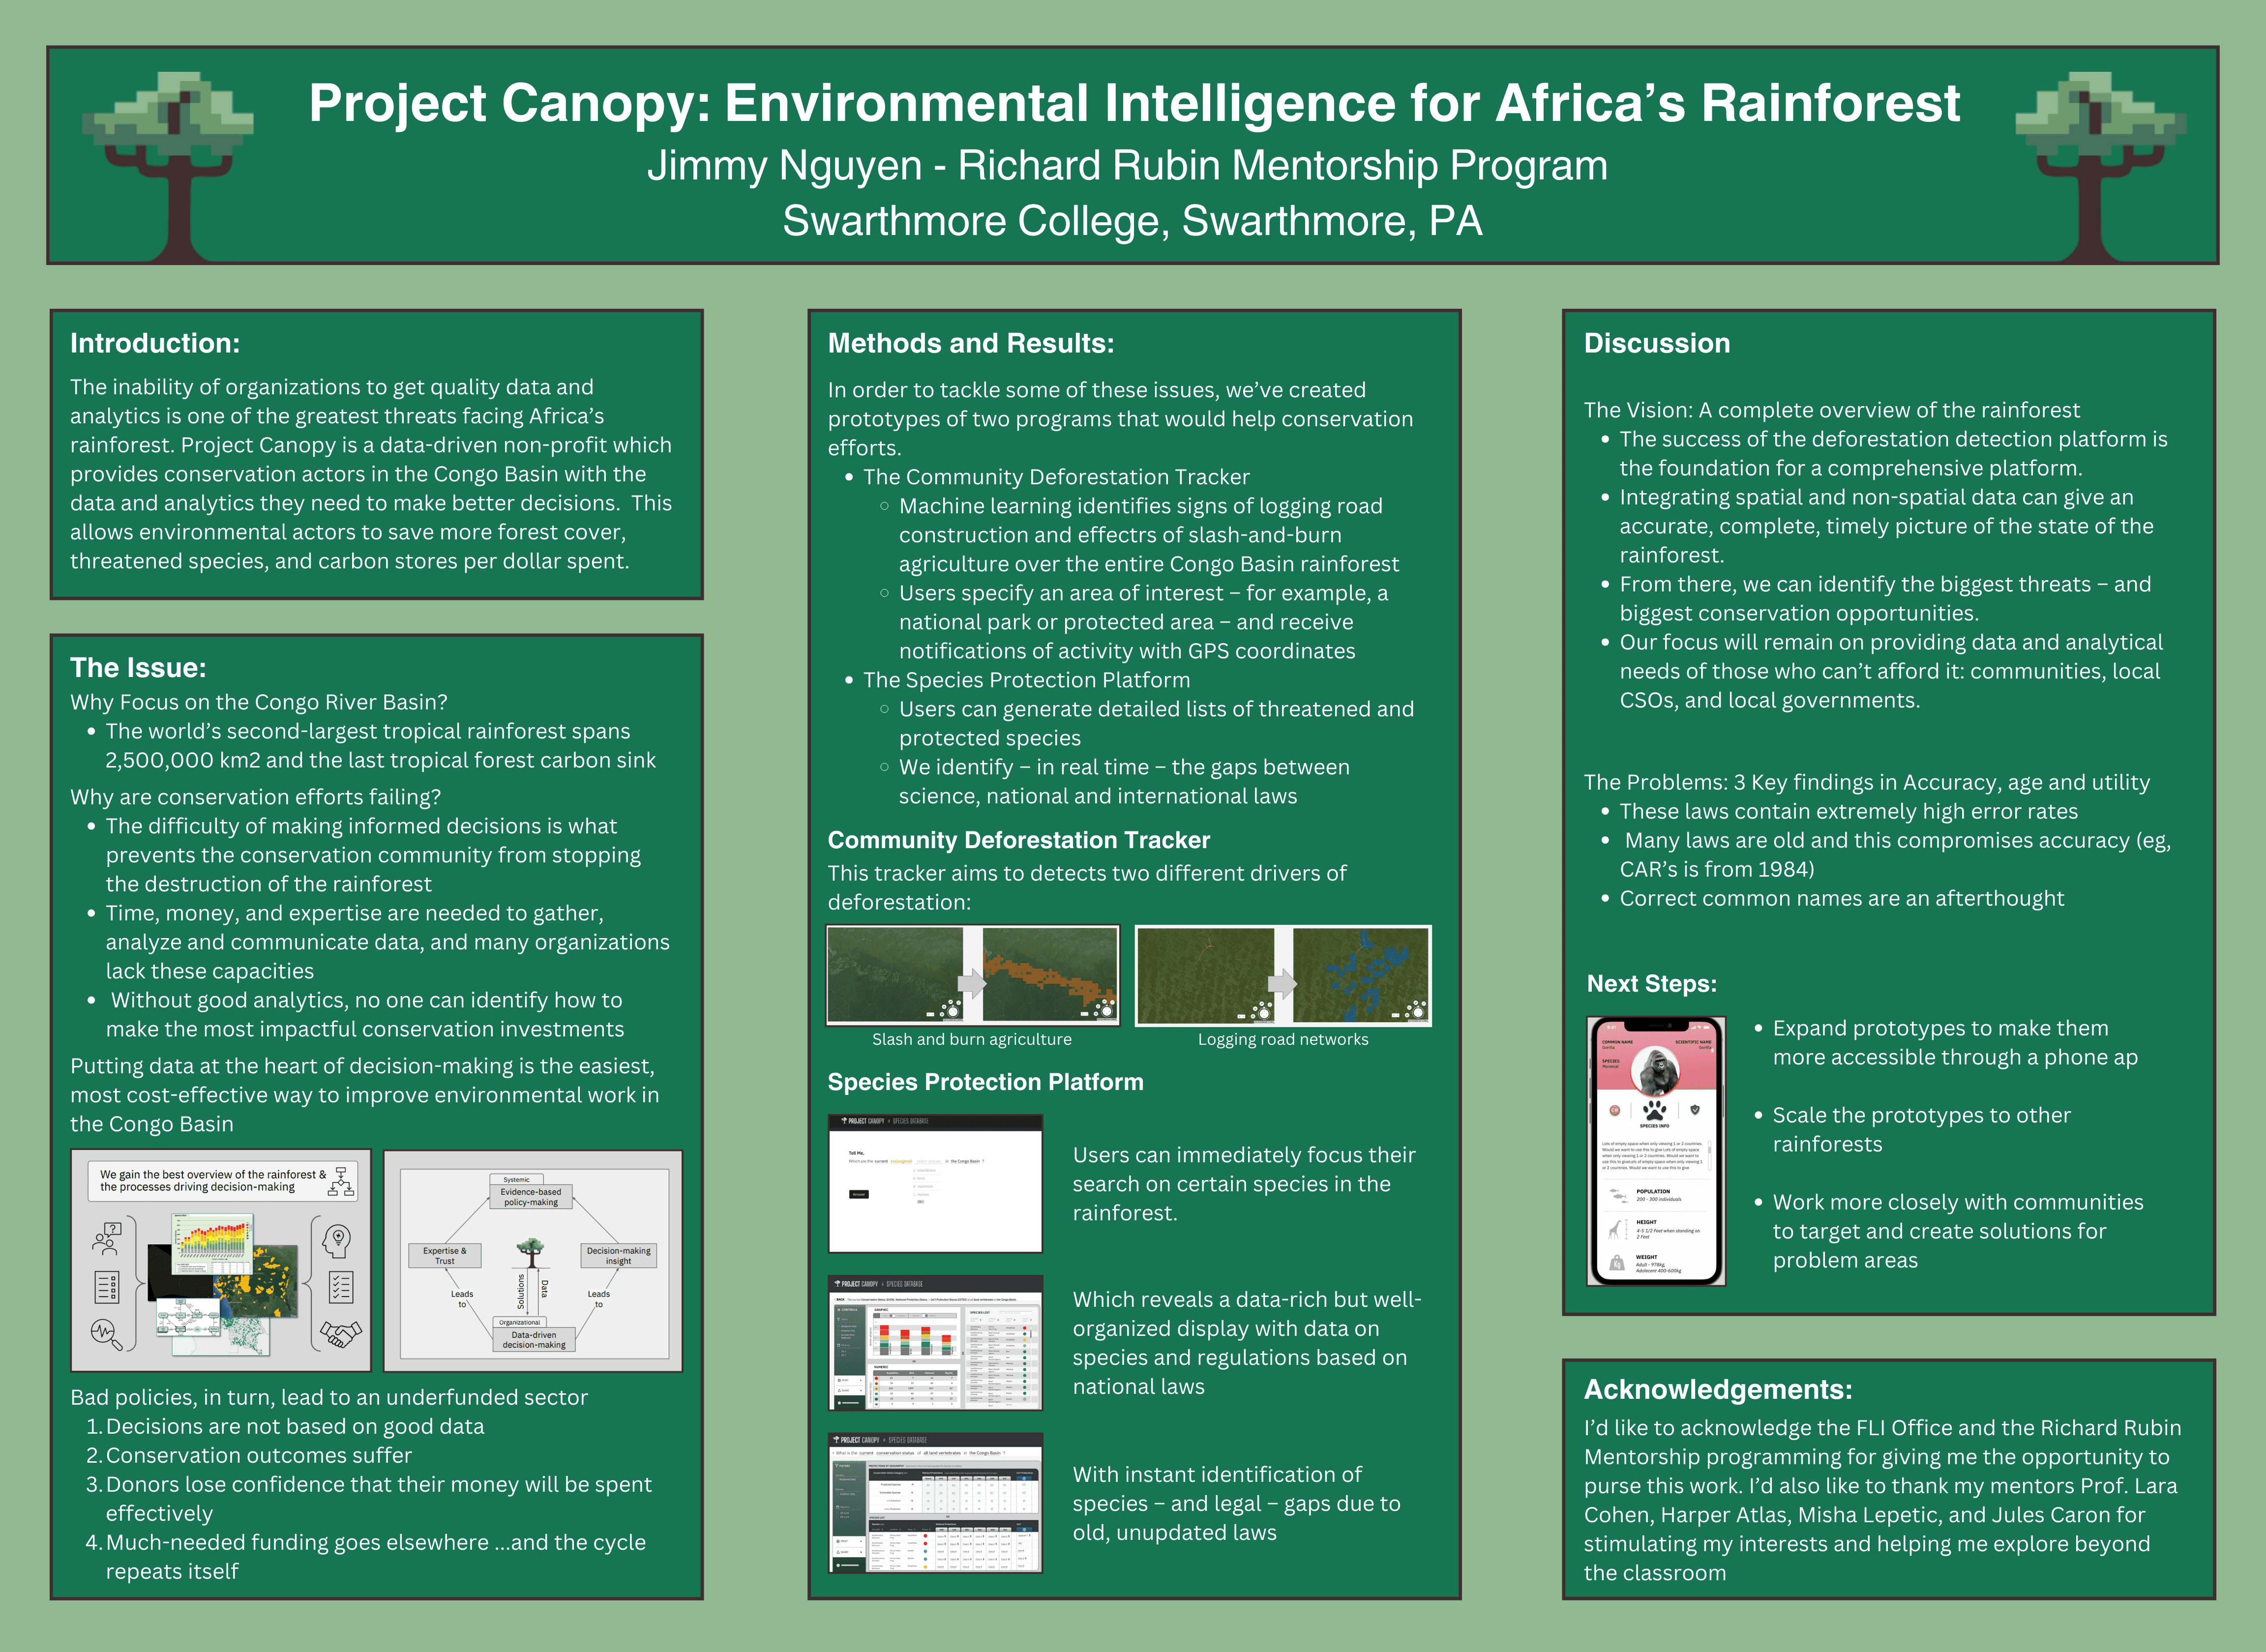
I also designed the research poster that presented Project Canopy's work through the Richard Rubin program, and I contributed to the pitch deck the organization uses for fundraising. This meant taking dense, technical information and making it scannable: the funding disparities in conservation, the feedback loop between data quality and policy outcomes, the technical architecture of the prototypes.
Challenges
Working with Mentors
Most of my other projects have been for general audiences or classroom contexts. Project Canopy was the first time I designed for people who already knew exactly what they needed and had no patience for interfaces that got in their way.
Consumer UX often assumes users need guidance. Onboarding flows, tooltips, progressive disclosure. I noticed that expert users don't need that. They need density, and they need it legible. They need to trust that the tool will do what it says. A forest monitor who's been tracking illegal logging for a decade doesn't need me to explain what a GPS coordinate is. They need the coordinate to be accurate and the alert to be timely. This shifted how I thought about information hierarchy. In a consumer app, you might hide complexity to avoid overwhelming new users. In an expert tool, hiding complexity can make the interface feel patronizing or, worse, untrustworthy. I had to learn when to simplify and when to expose.
I also couldn't rely on my own intuition about what users needed. I don't know how forest monitoring workflows operate. I don't know the structure of environmental law across Cameroon, Gabon, the Republic of Congo, the DRC, Equatorial Guinea, and the Central African Republic. I don't know how international NGOs coordinate with local civil society. I had to ask questions constantly and trust that the people who'd been doing this work for years understood their needs better than I did.
Working Remotely Across Time Zones
The team was distributed across the Congo Basin, Europe, and the US. I never met anyone in person. All collaboration happened asynchronously through Slack, Zoom, and documented handoffs. This forced habits I've kept since. Document your work clearly so someone in a different time zone can pick it up. Ask questions early rather than waiting until you're stuck. Don't assume context. Be explicit about what you're doing and why.
Conclusions
Impact
For me, the impact was very personal. As part of my fellowship, I had to write a reflection, and it kept returning to a single idea: that my work, even when it felt small, carried weight. That data-driven tools could bridge the gap between scientific knowledge and policy action. I still believe that, but I've gotten more specific about what it means. The interface is not separate from the data. How people access information shapes what they can do with it. The best analysis in the world is useless if the people who need it can't find it, can't understand it, or can't act on it in time.
What I Learned
This internship was where I sharpened my Figma skills in a professional setting outside of class and personal projects. I learned components, auto-layout, and prototyping. I'm still building on those skills. It was also my first time contributing to a codebase I, or my group members, hadn't architected. Someone else had made decisions about structure and patterns. My job was to understand those decisions well enough to extend them without breaking things. Code review was real, with very blunt, yet useful, feedback. And I learned that designing for experts is its own discipline. The heuristics you learn in an intro HCI course don't always apply. Sometimes information density is a feature, or sometimes users don't need onboarding.
Reflections
This project was more applied and hands-on than some other work in my portfolio. It's not a course project or a personal experiment. It's software that conservation organizations use to make decisions about protecting the world's second-largest rainforest. That context changed how I approached every choice. The people using these tools were working on problems more urgent than anything I'd personally experienced. I never met them, but every interface decision had downstream consequences for their work. It also clarified what I want from HCI as a discipline. I'm not just interested in making technology usable. I want to make it useful for the people and causes that need it most.


